Valuescan
Valuation Technology
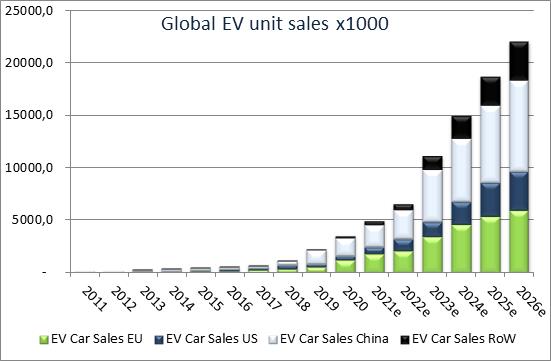
1. EV = Cars x EV%
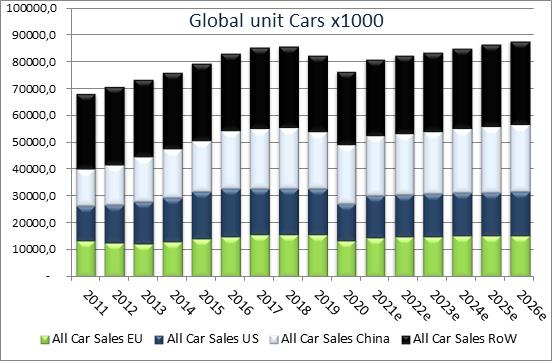
Annual car sales declined even before COVID-19
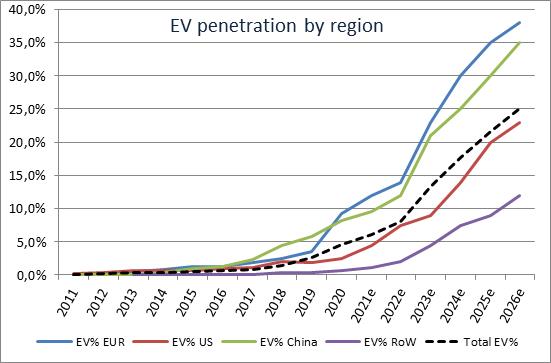
Annual EV Penetration in Europe takes off (subsidies)
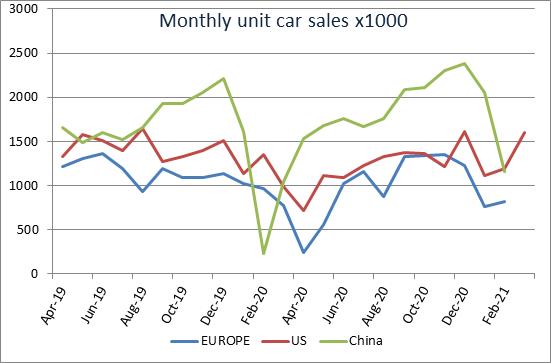
Monthly car sales in China recover, US recovers in 2021
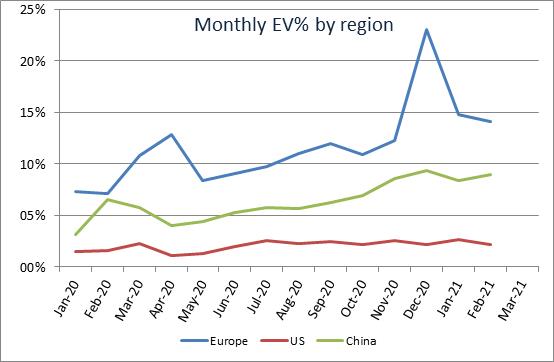
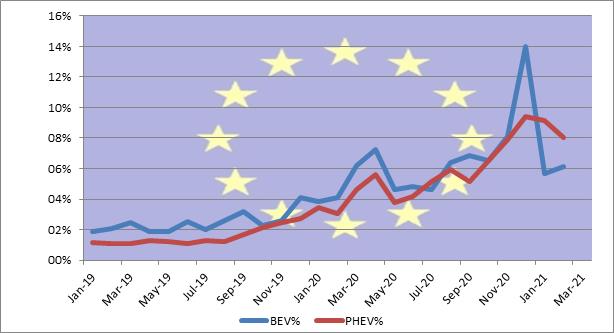
Monthly EV penetration benefits from low car sales / EU fines
Monthly EV penetration benefits from low car sales
2. BEV vs. PHEV
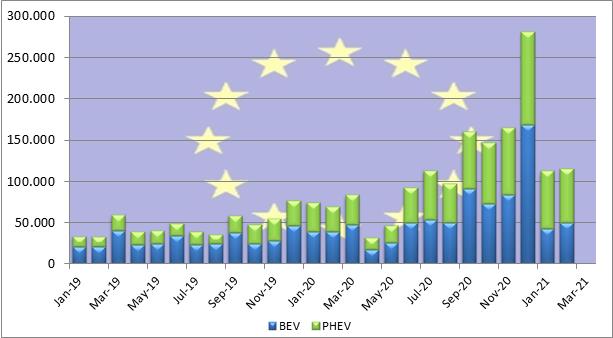
BEV and PHEV suffered in April/MAy
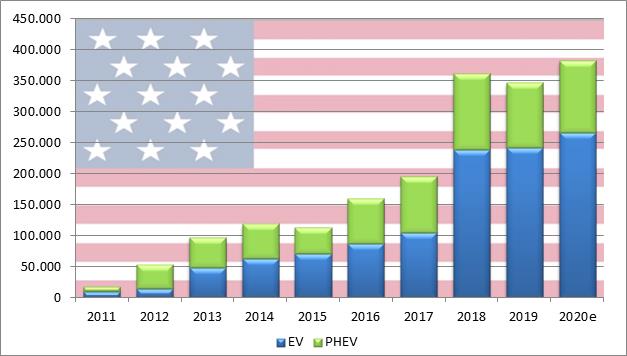
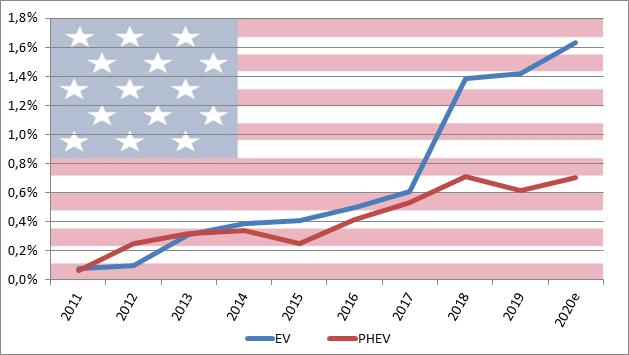
Annual PHEV is trailing in US
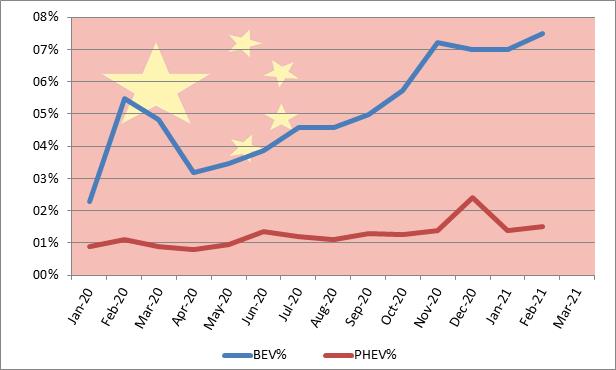
China PHEV is far behind BEV
PHEV and BEV penetration in % track closely
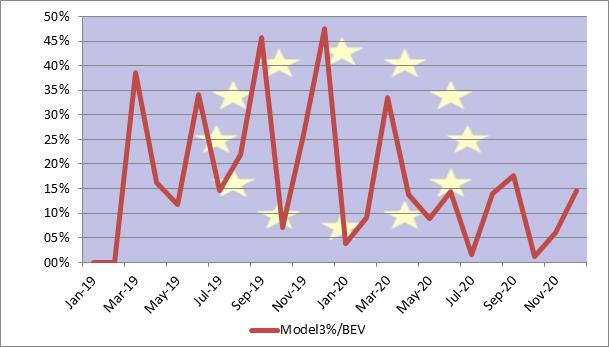
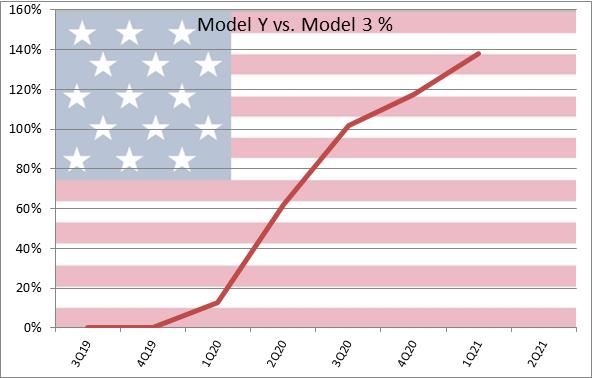
Tesla Model 3 and Y boosts BEV vs. PHEV in US
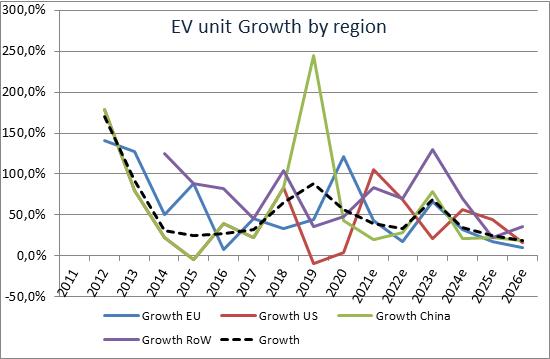
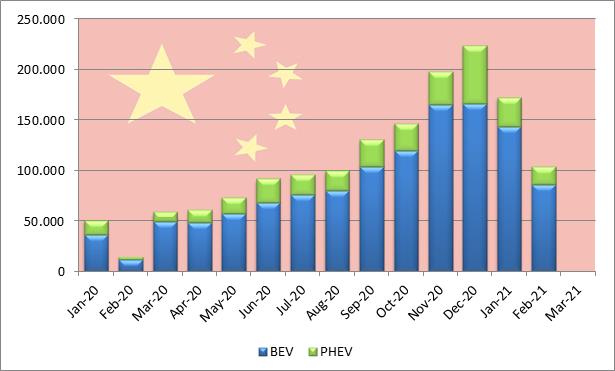
Growth is driven by BEV in China
3. Brand/Models
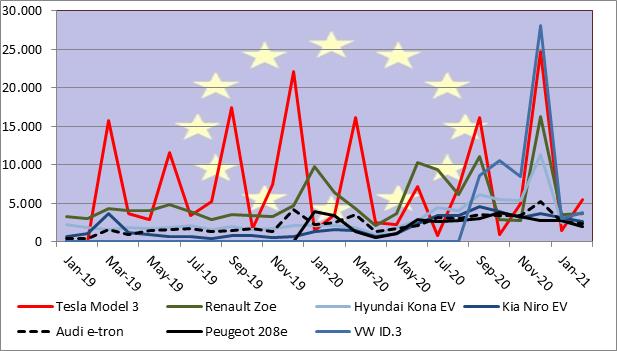
In Europe Tesla M3 is flat, others emerge
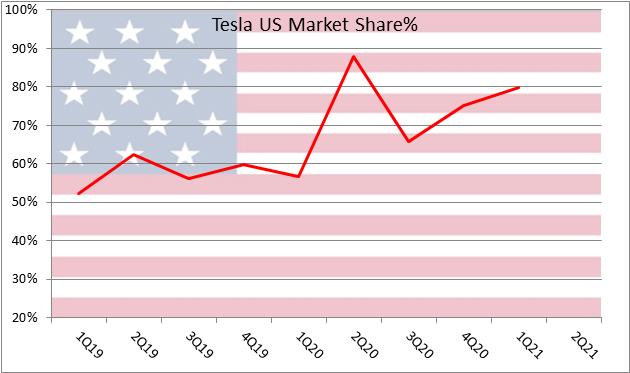
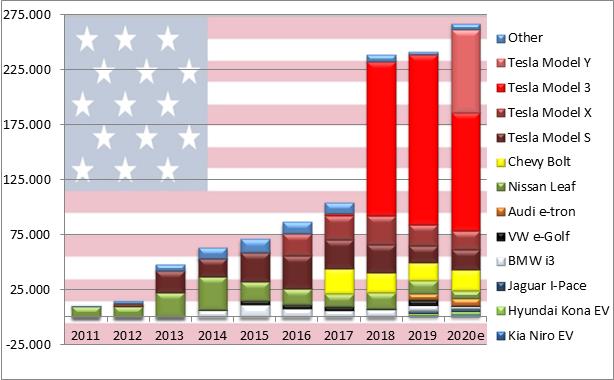
Tesla is >75% of US BEV market
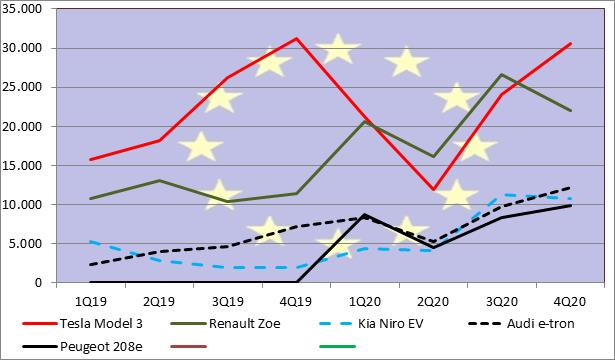
Tesla M3 stays ahead in 4Q20
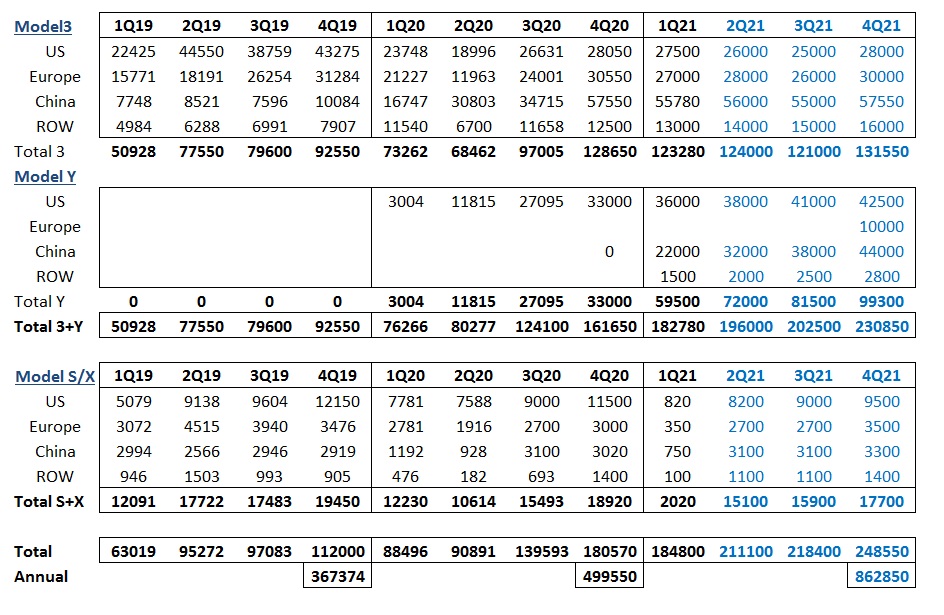
Quarterly Tesla deliveries filtered out
Tesla US market share remains high, no competition yet
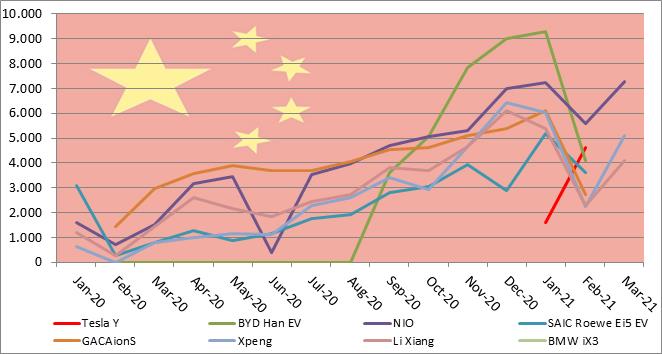
Many Chinese brands take share
4. Tesla Special
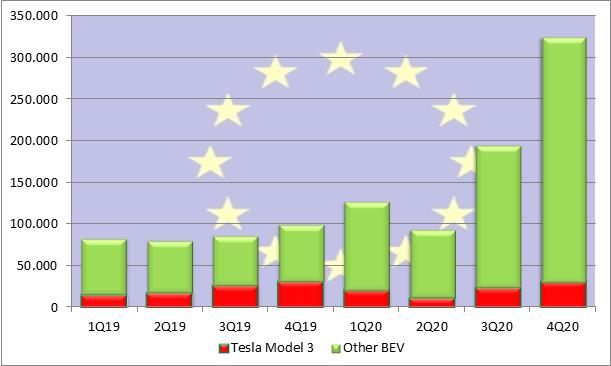
In Europe the EV market exploded over 4Q
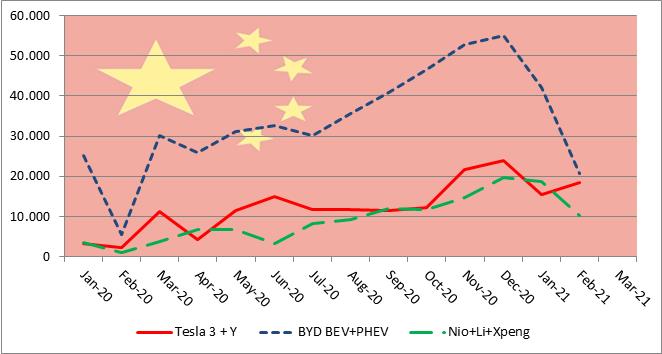
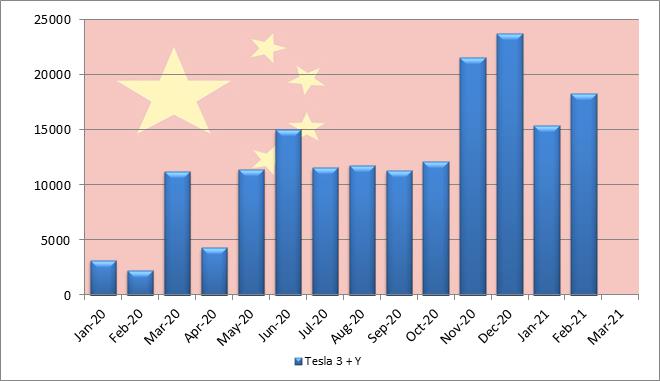
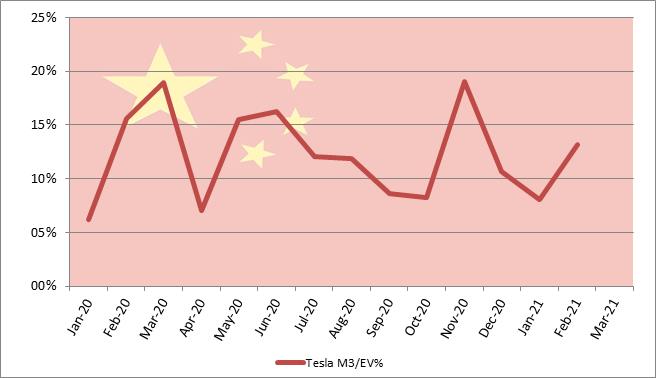
Tesla M3 grew strongly in China
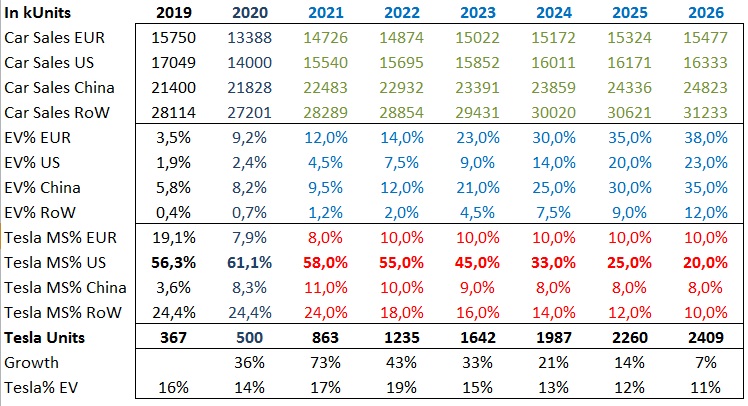
Tesla LT sales projection
Tesla M3 lost EV market share in Europe over FY20
Tesla market share in US stable around 60%
But China EV market share stabilises
Tesla quarterly sales by region